Get a grip on your backlog & have stakeholders on the same page

Before we kick-off
This article explains a way to get grip on, and to evaluate, your backlog. It’s how we — Off The Record — look at it. But it is by no means perfect. We believe in iterative development and apply this to our own Way of Working as well. We iterate on it for every team. By sharing, we hope to inspire others to reflect on how they develop products. Feel inspired, choose to adapt on it or chat with me about other interpretations.
Now let’s start. 🏁
When I started my job as PM a first thing peers told me: ‘Learn how to say ‘no’ to stakeholders. They will overwhelm you with requests for more and more development time’. Now, a few years later, I still understand this warning. However, I think instead of warning each other, PMs should discuss underlying problems and solutions. This way, we can tackle the problem to improve the process and gain a better grip on the backlog.
Hence, I wrote this blog.
Last years I experienced two returning main problems with stakeholders:
#1 Stakeholders impose their initiatives on you
#2 Stakeholders state you don’t spend enough development time in their area
I found it difficult to deal with these problems. Just saying “no” — as peers told me — and explaining the importance of what was already planned, was not enough. I felt the need to create more transparency for my stakeholders. After all, they already got confused by opening Jira or another tool.
Consequently, I read many articles about backlogs, scrum stakeholder management and how to find a balance between innovation, marketing, and maintenance requests. Nevertheless, none of those articles completely helped me solve my issues.
Thus I combined tips and tricks with my own ideas and experimented with it. We have applied this at several clients and the ideas evolved into three rates. The rates are an add on to a way of working and make these problems workable.
Before you can apply the three rates to solve the problems I would like to explain how we see a product backlog and how idea items end up on it.
How we see a product backlog
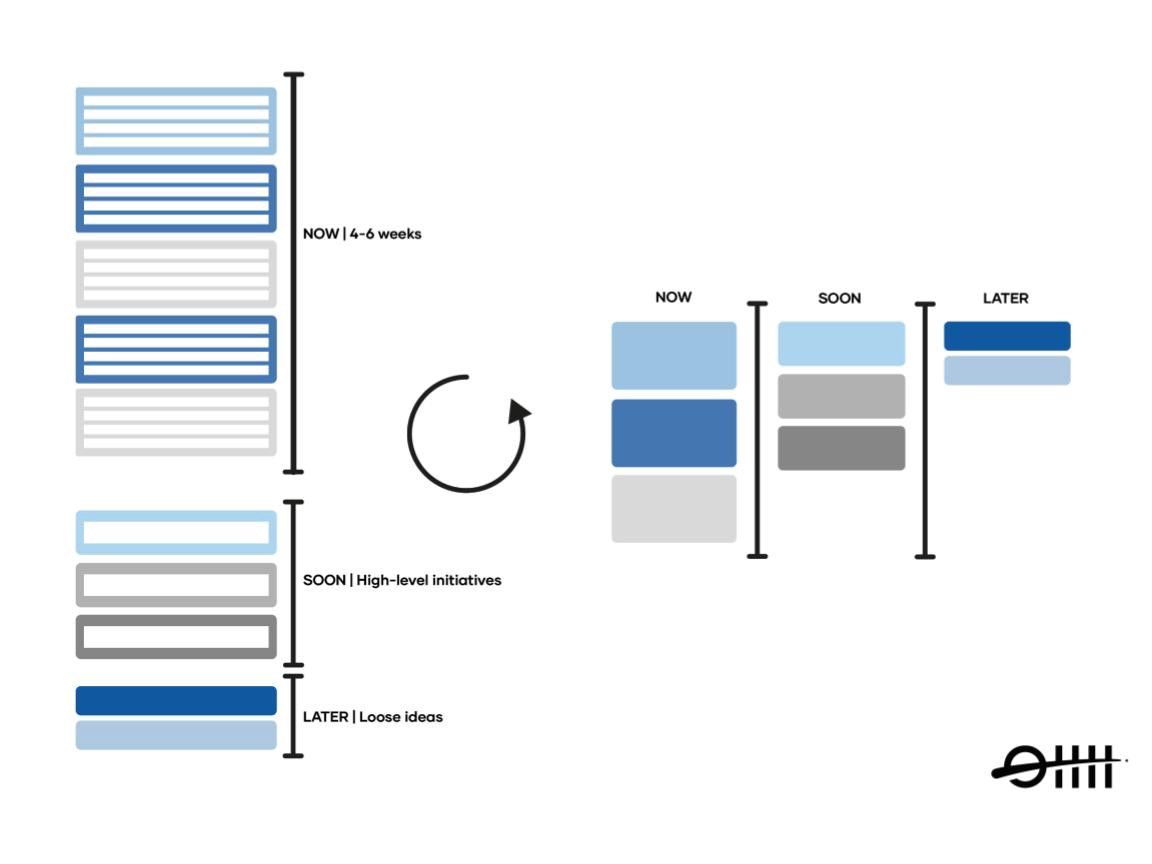
A backlog is a list of items that you build over time. On top, you find refined user stories or tasks that belong to — let’s name it — an epic. This epic is part of an initiative that drives toward a common goal or as we name them OKRs- Objectives & Key Results.
When items are situated in the centre of the backlog, they evolve in more high-level initiatives. These initiatives soon need more refinement to make them more specific. But before this detailing takes place, it already needs to have a project scope with a shared understanding of what we are going to build and why.
Lowest on the backlog you find the loose idea for solving a solution. Next, to this backlog we have a ‘might do’ list. This list includes all the ideas we could build in the future.
*An obvious trick but still an interesting insight 😎 → When you turn the backlog counter-clockwise you recognize a roadmap (more on roadmaps in a later blog). This view simplifies the many refined tickets to initiatives and makes it easier to understand. You can visualise this in Trello, Excel or on a wall with post-its.
#1 Stakeholders impose their initiatives on you
Ideally, we like ideas on the backlog to be validated assumptions and have ideas contribute to reaching goals or OKRs. And so, the first task we start with is to check the ideas on validation and second check the association with OKRs. This check helps us to make sure we spend time and money on the right initiative.
Now I hear you think: ‘All well and good, but my stakeholders sometimes just enforce a new feature and want to build it right away. They don’t want to validate because they are scared of losing time and truly believe in the idea.’
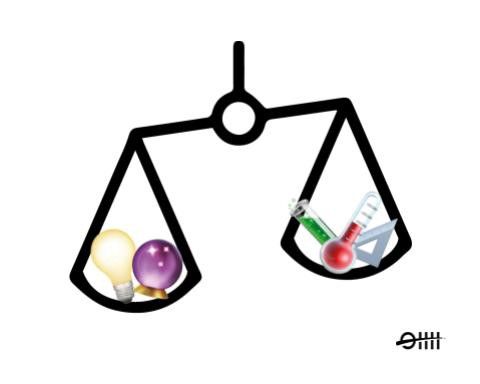
That’s OK. We can not validate everything. Therefore, we hold that ideas can be drawn from two sources:
1| Belief 🔮→ Initiatives based on something stakeholders identified in the market, vision or a fanatic opinion.
2| Data 🌡 → This can be qualitative or quantitative data, which is gathered from users/customers and the performance of your product usage.
The source- & OKR contribution rate
Challenge yourself to balance the source of the ideas on the backlog. You don’t want a backlog mainly based on stakeholders' beliefs since they might be wrong. On the other hand, do not go extreme and only build validated initiatives.
Therefore, measure your source rate. How? Implement an extra custom field in your epic issues in Jira (or another tool) to select the source of the idea.
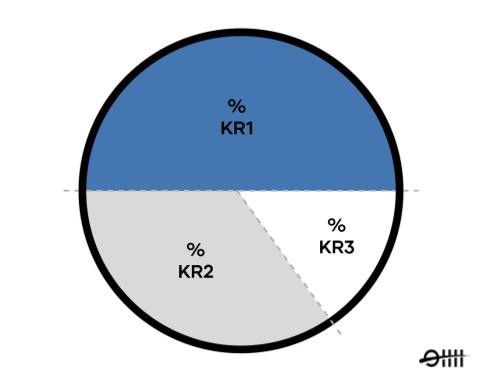
In addition, add an extra field for OKR checks in your Jira issues. Do this to measure the OKR contribution rate.
Add the rates to your Jira dashboard. Now you can evaluate the association of issues to an OKR by the OKR contribution rate and see the balance of your sources by the ‘source rate’.
When you have an idea drawn from beliefs, make sure you break it down, start small, deliver for a selected user group and reflect on it. It will generate new data upon which we can evaluate the success of the idea.
#2 How to deal with stakeholders who think you don’t spend dev time on their area.
We now know how to verify ideas stakeholders push towards you → #1 ✅.
Although stakeholders might still have statements like: ‘Why do we spend so much time on implementing tracking. We need to innovate and be a market front runner.’ Or someone from a marketing department says: ‘You never have time for parts I need.’
I don’t blame them. They might not see that the development of a product does not stop after one idea is build. Besides, it is quite human to forget the work that was developed for you that year or quarter.
Consequently, it is valuable to create transparency about the time spent on a development goal. It helps you to get a grip on everything you have built and visualizes the bigger picture of development.
The development goal rate
We label initiatives based on three development goals. Again you create an extra custom field in Jira to add one of the labels in an issue. This enables you to display the time spent on development goals for planned sprints and closed sprints and so visualize the development goal rate.
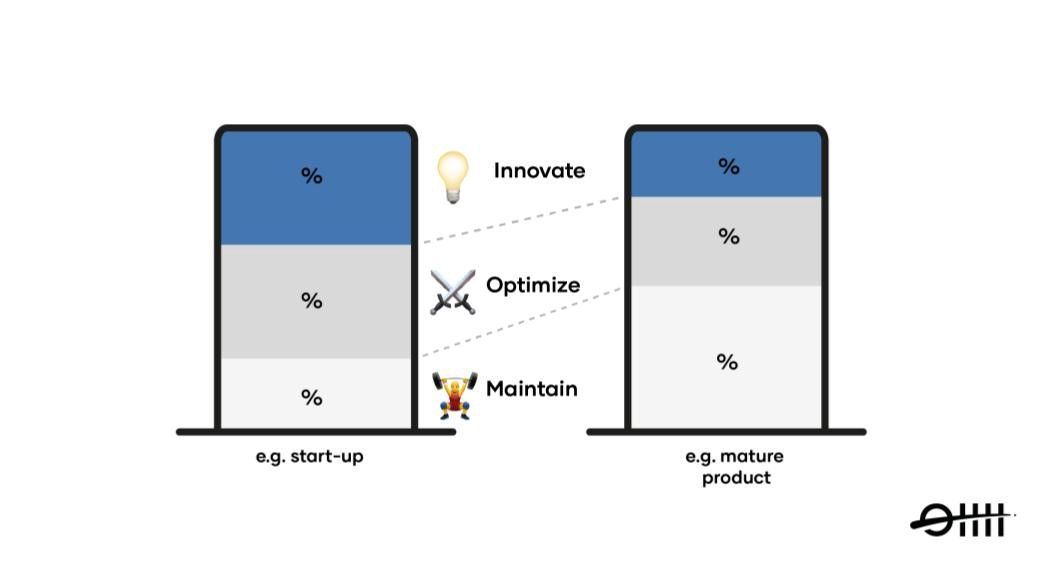
The three goals:
- To Maintain 🏋️♀️
Goal: Maintain the product to keep it alive.
E.g. Rewrite-code, expand the cloud, implement tracking, bug fixing, technical dept research, tool stack implementation - To Optimize ⚔️
Goal: Optimize the existing business to improve metrics.
E.g. Loyalty program, marketing push notifications or UX changes - To Innovate💡
Goal: Innovate the existing business to improve metrics.
E.g. Initiatives that require complete new designs, codes, and flows.
Work on all three goals at the same time, whilst you dedicate a % of the backlog to each goal per quarter.
The stage of your company can guide you to select items and to find a balance between development goals on the backlog. A start-up will spend the majority of time on optimizing and innovating, whereas a more mature product will spend more time on maintenance. However, companies with mature products should not forget to innovate and optimize to stay relevant to customers. Otherwise, these products lie still and eventually, you will see this lack of innovation or optimization in the numbers.
Evaluate your sprints and quarters
Show visualisations of the three rates in sprint reviews. Visualise the charts for a year to date-, quarter- and closed sprint time frame.
Your sprint review charts:
- The source rate
The source division of ideas - The OKR contribution rate
The association of issues to an OKR - The development goal rate
A high-over backlog distribution of 3 development goals
I found that these charts create understanding and trust among stakeholders which got them on the same page as me. Stakeholders could recognize what kind of considerations are made, based on what kind of sources and why this was important. For example, by seeing the charts, a marketer had more trust in the backlog. Now she understood there were more factors in place that play a role instead of to think it is solely a PMs opinion.
Further, I experienced a better sense of time spent by the team on a development goal and consequently know how to distribute future development time among initiatives from different business area’s. This gave me a better grip on the backlog.
All in all, the source and OKR association help to make idea selections. Whereas the development goal rate creates transparency. When we visualize these three metrics and so show what the team is and has been working on stakeholders more easily realize the bigger picture of product development, which helps you as PM to say ‘No’ or ‘Yes’ to stakeholders with a mutual understanding.
Together the rates provide a way to get a grip on your backlog and have stakeholders on the same page.